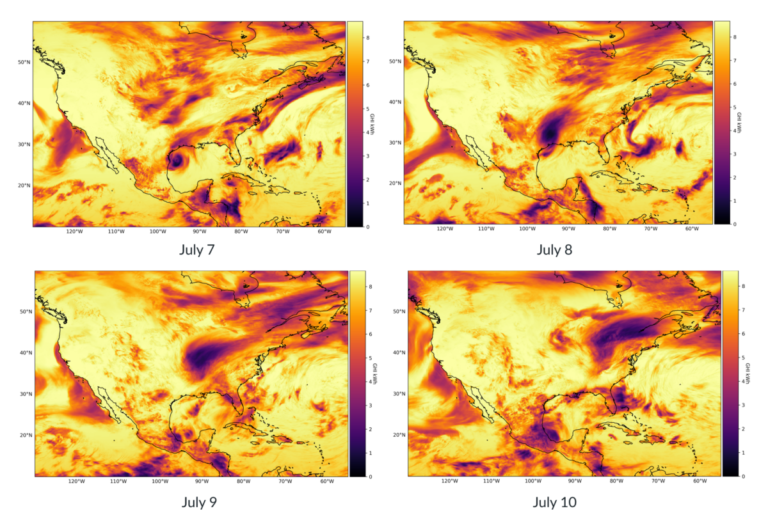
In a new weekly update for pv magazineSolcast, a DNV company, reports that Tropical Storm Beryl on July 8 caused a large but temporary drop in solar generation potential across Texas. However, cross-referencing with reports from grid operators showed that very little generation went offline as a result of the storm. demonstrating the resilience of Texas’ solar infrastructure.
Despite Tropical Storm Beryl making landfall on Monday morning, July 8, relatively sunny conditions returned as the remnants of the system moved northeast, according to analysis using the Solcast API. Although Southeast Texas was hit the hardest by damaging winds and flooding, cloud cover from the severe weather system caused a large but temporary drop in solar energy potential across the state.
Solcast’s analysis of potential utility-scale solar energy generation in the ERCOT power grid region indicates that cloud cover associated with Beryl significantly dampened solar energy generation on the morning of Monday the 8th. Cross-references to reports from the grid operator
reveals that very little production went offline as a result of the storm, demonstrating the resilience of Texas’ solar infrastructure. Skies over Texas were relatively clear on Tuesday, with only isolated convective storms as Beryl moved northeast. According to forecasts from the ERCOT Power Region, expected thunderstorms over the coming weekend will likely put only a mild dampener on solar generation in the ERCOT Power Region, with the Southeast hardest hit. Solcast API.
Comparing the second week of July to previous years, total ERCOT production this week is expected to be just 3% below typical production levels. However, ERCOT’s Southeast and Far East sub-regions were hit harder by Beryl’s cloud cover, with generation this week more than 15% below average, highlighting the localized nature of the storm’s impact on solar generation. shows energy.
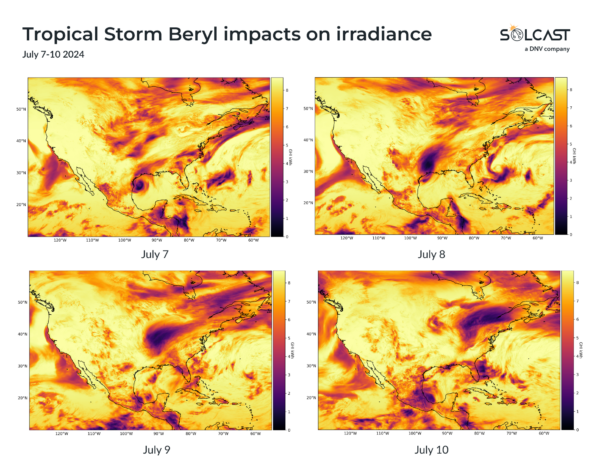
Tracking Beryl’s impact on daily insolation reveals a relatively small, well-structured storm on Sunday the 7th, just before landfall. As the storm moved northeast and rapidly weakened, the peak in severe weather near the core subsided, but the spatial impact on insolation
increased as the system lost its structure and spread. This pattern shows how the storm’s dissipation affected solar energy potential over a larger area.
Solcast produces these figures by tracking clouds and aerosols worldwide at a resolution of 1-2 km, using proprietary satellite data AI/ML algorithms. This data is used to drive irradiance models, allowing Solcast to calculate high-resolution irradiance, with a typical deviation of less than 2%, as well as cloud tracking predictions. This data is used by more than 300 companies that manage more than 150 GW of solar energy worldwide.
The views and opinions expressed in this article are those of the author and do not necessarily reflect those of the author pv magazine.
This content is copyrighted and may not be reused. If you would like to collaborate with us and reuse some of our content, please contact: editors@pv-magazine.com.
Popular content


